Plastic bottles
Identifiable bottles; plastic bags are not bottles.
WASTE OBJECT DETECTION · PHASE ONE
Finding plastic bottles, metal cans and construction debris in mixed waste.
The model learns from public images, then faces real field footage. What does it find, what does it miss, and does it mistake the background for a target? Follow the method, the results and the limits of what they can tell us.
PROBLEM & SCOPE
A photo may contain bottles, bags, stones and other clutter. Objects overlap, get crushed or appear tiny. The task is to identify each target class and draw its location, rather than simply report that waste is present. YOLO26n is the object-detection model used here. We check what it finds correctly, what it misses and what background it mistakes for a target.
The controls show saved results. They do not train a model or run inference on new images.
Identifiable bottles; plastic bags are not bottles.
Identifiable cans; not every metal object is a can.
Bricks, stones and debris under the dataset annotation rules.
Weight estimation, automatic sorting, tyre detection and equipment control were not completed in this phase.
RESEARCH WORKFLOW
Step 1
The main comparison uses 1,195 images. Bottle and can photos come from TACO; debris comes from CODD, both public datasets. We first check that their labels match our target objects, then align the annotation format for training and comparison.
For example, an object labelled as plastic may be a bag. It cannot automatically serve as a bottle label.
803 images teach the model, 192 help check training and guide adjustments, and another 200 form the fixed Test used for comparison. No image appears in more than one group. Think of them as practice material, progress checks and comparison questions. About 92.7% of annotated objects are debris, so bottle and can results also need separate attention.
The main comparison uses one fixed split and seed 42. Later experiments repeatedly consulted the Test, so the next phase needs a new independent test set.
A and B use YOLO26n, 50 epochs, batch 4 and Mac mini MPS. The main difference is training size: 640 vs 960. Speed and same-weight input-size results are separate tests, not one joint experiment.
HUMAN REVIEW TOOLS
Formal blind annotation shows only the original image: identifiable targets are boxed; no-target and uncertain cases are recorded explicitly. Assisted review shows predictions and is stored separately.
These are screenshots of existing tools, not an annotation tool running on this page. The 20 submitted images are from saved historical records.
20 submitted images preserved; click to enlarge. Original interface in Chinese.
MODEL COMPARISON
A and B are two training runs of the same model. A uses size 640 and B uses 960. Larger inputs may retain more detail for small objects. Both are tested on the same 200 public images to compare object labels and box placement.
mAP50–95 × 100
mAP50–95 summarizes object labels and box placement into a comparison score, multiplied by 100 here for readability. The 200 Test images contain 1,457 annotated objects. Each class is scored separately and the class scores are averaged, rather than weighting debris more heavily because it is common. B gains 4.48 points, so it remains the reference for later experiments.
This is not field accuracy and does not mean 55.38% of field objects will be recognized.
Debris performs better; bottles and cans still need improvement.
A higher score does not mean every result improved. A miss is a real target the model fails to find; a false positive is a prediction where no target should be boxed. B slightly improves recall, the measure of finding targets, while precision, the measure of how often predictions are correct, falls. It also misses the planned recall-gain target. This is a measured trade-off, not completion of every acceptance goal.
Recall: 0.59549→0.60800. Precision: 0.64306→0.62332. B did not meet the planned recall-improvement target; not every metric improved.
C is another experiment that shows bottle and can examples more often during learning. Choose a case below, then Annotations for the human labels or Model comparison for labels on the left, B in the centre and C on the right. C helps some cases and hurts others, so it did not replace B. These are ranks 3, 4 and 8 from 20 deliberately selected hard cases. They explain errors, rather than estimate error rates for all photos.
Case-review settings: confidence 0.25 is the threshold for retaining predictions; matching IoU 0.50 is the overlap threshold for matching a predicted box to a human box. Confidence alone does not establish correctness.
B has no diagnosed misses or false positives in this case; C misses 3 and adds 1. One case does not establish overall performance.
FIELD FALSE POSITIVES & SPEED
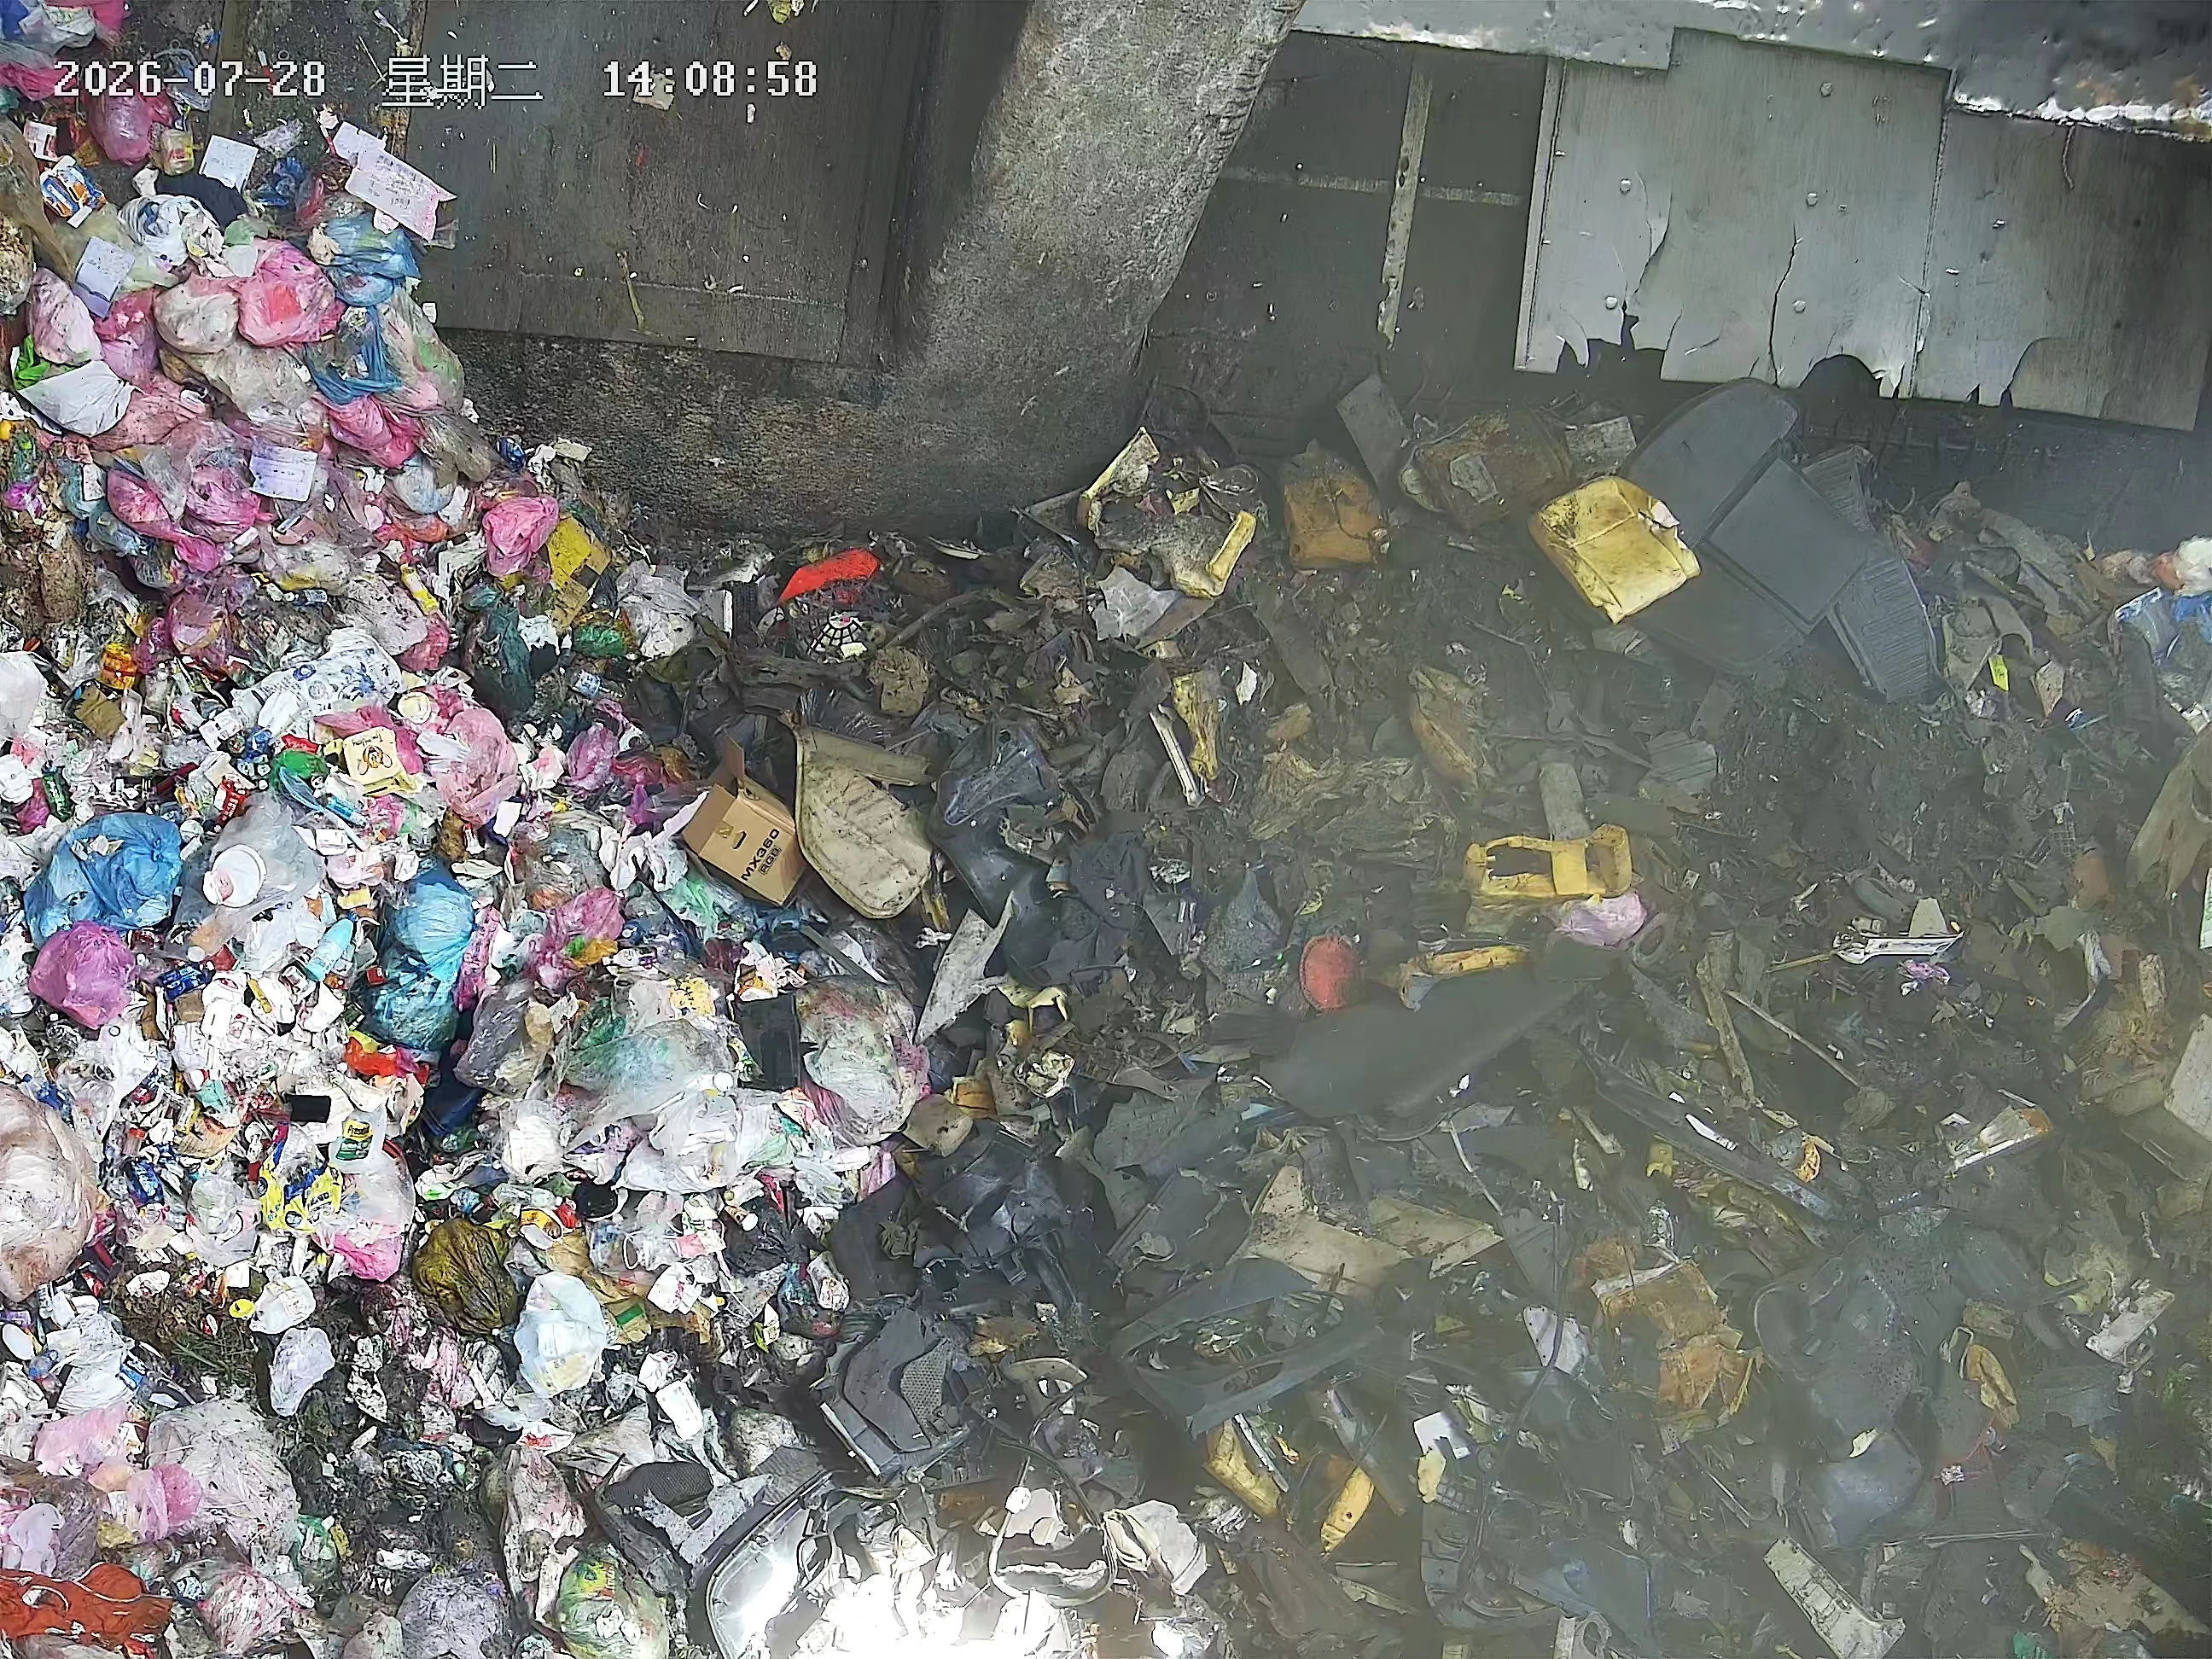
A human reviews the original image without seeing predictions first. This blind annotation avoids being influenced by the model. None of these 20 field photos has a clearly identifiable bottle, can or debris target under the annotation rules. They can reveal unwanted predictions, but cannot measure missed targets, field recall or full mAP. They therefore do not establish accurate field detection.
No targets of the three classes can be identified under the rules. This does not mean the image contains no waste.
Boxes come from saved predictions. High confidence can still be wrong.
| Measure | A2 | B2 |
|---|---|---|
| Images with false positives | 15 / 20 | 16 / 20 |
| False-positive boxes | 76 | 29 |
76 to 29 means fewer unwanted boxes across the same 20 photos. 15 to 16 means 16 photos still contain at least one false positive, one more than before. There may be fewer extra boxes per photo, while errors remain spread across many photos. The box reduction alone does not establish reliable field detection. A2/B2 label these field-test versions; this is separate from the 200-image public Test.
Field positives with clear targets are still missing; the proportion of real field objects detected remains unknown.
This comparison keeps the trained B model fixed and changes only the image size it sees at prediction time. Size 640 uses smaller inputs and runs faster; 960 retains more detail but takes longer. The controls show recorded measurements. Public-Test scores and speeds from two short videos were measured separately, not as accuracy and speed on one shared set of frames.
FPS means frames processed per second. At size 640, these two short videos run at about 70 FPS, above their declared 60 FPS. The same B model scores 53.56 on the public Test, 1.82 points below size 960. Size 640 merits further testing when keeping up with video matters; size 960 offers a score gain at a higher processing cost.
Decoded frame counts differ from declared counts. Source integrity and long-running streams still need verification; these short tests do not prove production real-time readiness.
CONCLUSION & FULL REPORT
This phase establishes the research workflow and measures the score, speed and false-positive trade-offs of larger images. The missing evidence is whether the model finds real targets in the field. The next phase needs clearly identifiable bottles, cans and debris across times and cameras, followed by independent evaluation and long-running video tests before production suitability can be judged.
Full research report · popup reader
This presentation is based on recorded 10_DEMO results. Selected images and necessary data are copied into the portfolio; original research files are preserved. Bottle/can sources: TACO. Debris source: CODD. Dataset reference annotations are retained.
The full report retains the formal v1 Chinese original. The public copy removes machine paths and video identifiers without rerunning experiments or changing results. Pages 14, 15 and 20 are de-identified image pages, so their text cannot be selected. Tool screenshots are from the later portable edition with 20 saved submissions; earlier screenshots in the report show 0 and do not mean submissions were lost.